Claymore-Lowlands
Solid Foundations: Data - Mathematics - Tons of Experience

Solid Foundations: Data - Mathematics - Tons of Experience

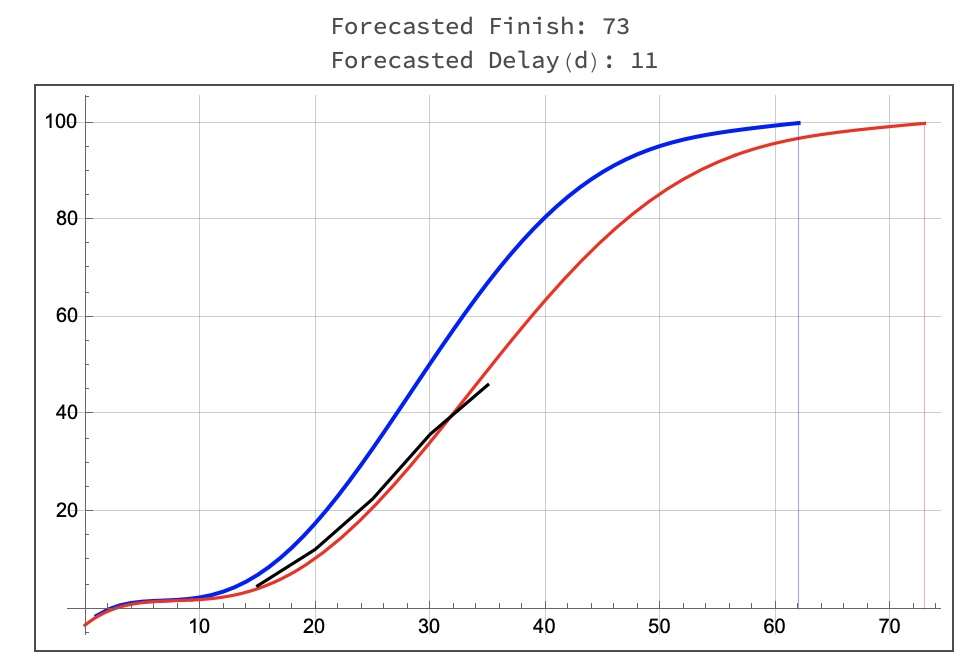
We now can forecast the finish date of a project or any part of it based on these inputs:
Using AI techniques we now can generate a forecasted progress curve (red)
We then can compute the forecasted finish date and delay.
Forecasting in project monitoring has been around for some time.
Yes, it's a bit more complicated that applying linear extrapolation or a rule of 3.
As always, one has to be very cautious when interpreting forecasts. The technique we use is probably one of the most reliable.
